Optimizing Race Strategy in Motorsports: The Power of the Undercut and Overcut
We often think that the success of a Formula 1 car during a race is down to its driver, horsepower or aerodynamics, yet strategy (under and overcut) can have a much more decisive impact on results. After all, it doesn’t matter how fast your car is, if a bad pitstop strategy puts you at the back of the field.
Race undercut and overcut strategy has played an even more important role over the last few decades, as teams and their technologies continue to evolve, the performance differentiators between cars reduces. With similar pace and performance on track, sometimes a good strategic call can be the only card teams can play to overtake the opposition.
Race strategy in the past
Before 2010, the regulations allowed refuelling, which meant the lap time difference between a near-empty car and a heavy, refuelled car was around 1.5s. Although the performance from a new set of tyres could reduce this deficit, it was difficult to overcome this penalty entirely. So, fuel became the dominant variable when establishing the optimum race strategy.
However, after refuelling was banned, tyre performance was once again the most important strategic factor. Consequently, teams focussed on managing tyre degradation to try and devise undercut and overcut scenarios to overtake their competitors.
Understanding tyre performance
To understand how undercuts and overcuts work, we first need to understand the behaviour of tyres.
The rubber used in today’s Formula 1 tyres is strongly influenced by temperature and hysteresis, so the lap time a car can achieve varies considerably depending on what stage of life the tyre is in.
There are essentially three main stages of tyre performance during a stint: warm-up, stabilisation and degradation. The amount of grip the tyre generates in each of these stages varies according to the stiffness of the compound (Soft, Medium or Hard). The graph below illustrates the typical lap time difference between a Soft, Medium and Hard compound throughout a stint.
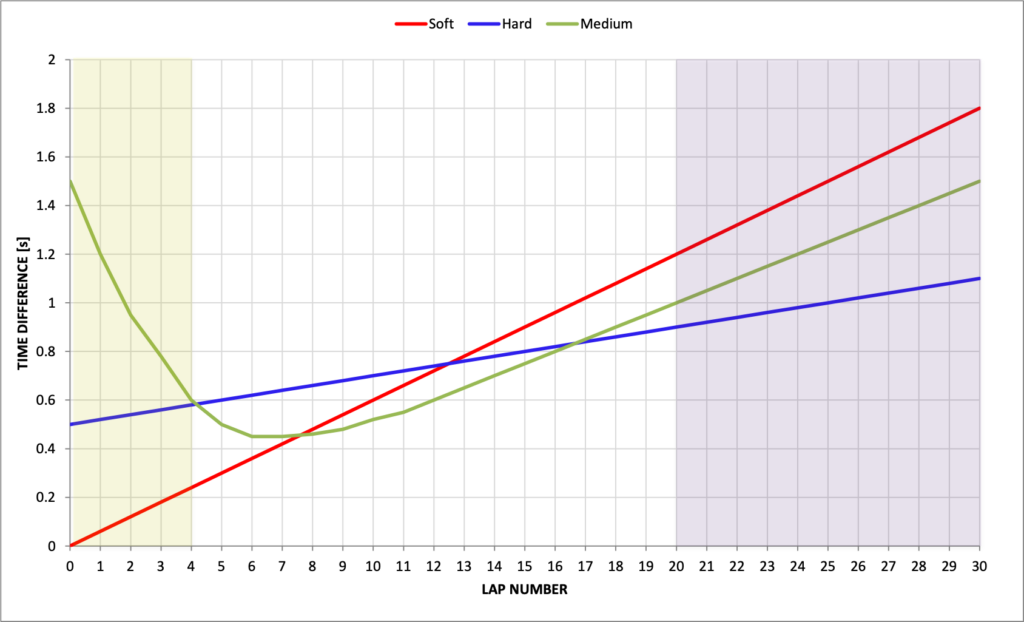
- The Soft compound warms up the quickest and so has the fastest initial lap time. However, as the softer rubber begins to overheat and therefore wear, its performance drops off significantly towards the end of the stint.
- The Hard compound builds temperature more slowly and so takes longer to warm up which is why it is 0.5s slower than the Soft on lap 1. However, the harder compound is more resistant to overheating and suffers less wear, sustaining performance for longer and by lap 30 is 0.7s faster than the Soft.
- The Medium compound often sits between the Hard and Soft in terms of performance. Although, this compound can sometimes be difficult to warm up and is therefore much slower than both the Hard and Soft at the beginning of the stint.
The lap time difference between old and new tyres as well as the different compounds during the warm up (yellow) and degradation (purple) phases presents an opportunity for teams to either undercut or overcut their opposition.
What is an undercut?
F1 Undercut explained
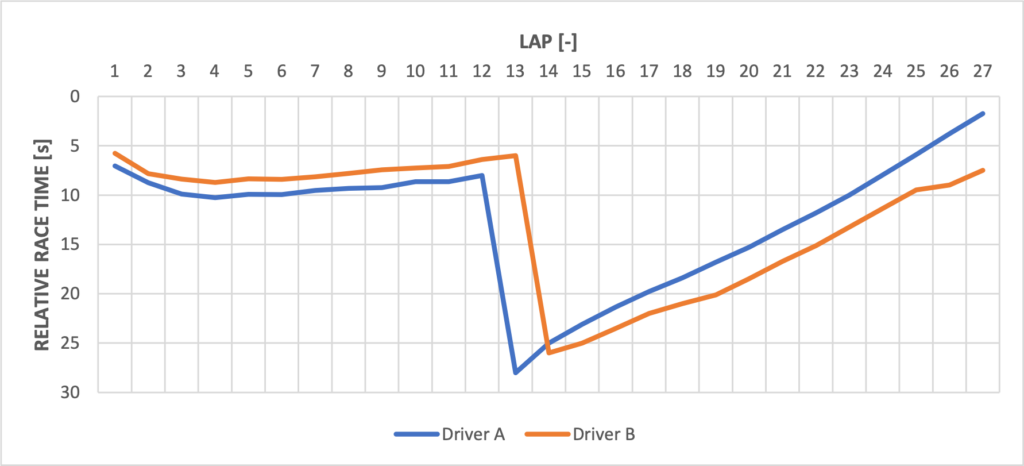
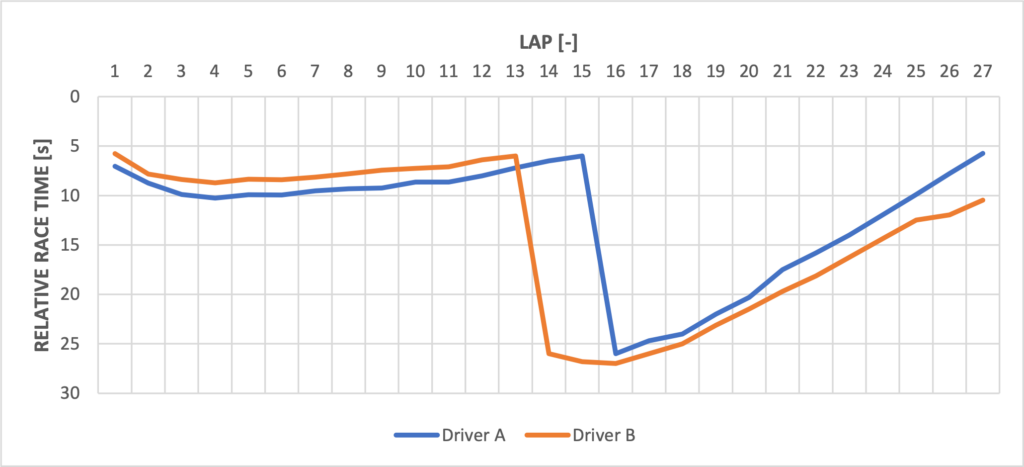
The undercut is a race strategy where a driver pits earlier than their rival to gain an advantage by using fresher tires. The key to this strategy lies in three critical stages: the inlap, the pit stop, and the outlap. The total time lost or gained during this sequence can result in a successful overtake, as fresh tires allow the pitting driver to post faster lap times compared to a competitor on older, slower tires.
In an undercut scenario, Driver A pits first and loses time in the pits (around 20 seconds), but once they return to the track on fresh tires, they can complete a much faster outlap. Meanwhile, Driver B, who stayed out on worn tires, completes a slower inlap before eventually pitting. By the time Driver B completes their stop, Driver A has already used the speed advantage from fresher rubber to gain track position, overtaking Driver B.
The undercut is particularly effective on circuits with high tire wear or thermal degradation, where fresh tires immediately offer better performance. This strategy capitalizes on the fact that older tires degrade significantly, slowing the car’s pace. If timed perfectly, the undercut can help a driver leapfrog ahead of their rival by leveraging the grip and speed of new tires.
Key Factors for a Successful Undercut:
- Tire performance: Fresher tires provide better grip and speed, giving the pitting driver a significant advantage. Timing the pit stop early enough to make the most of these new tires is crucial.
- Clear track space: For the undercut to work, the driver must rejoin the track with enough space ahead to exploit the fresh tires without being slowed by traffic. A traffic-free window allows the driver to push aggressively.
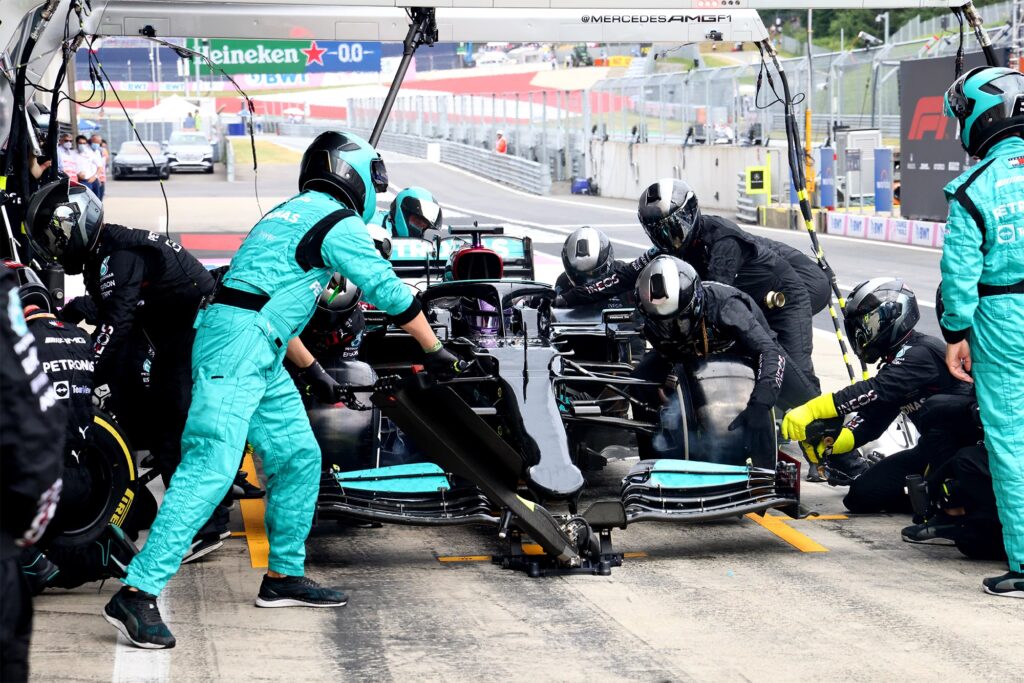
- Pit stop efficiency: A smooth, quick pit stop is essential. Delays in the pit lane can negate the advantage of fresher tires, so minimizing pit time is key to a successful undercut.
- Track conditions: Circuits with high tire degradation favor the undercut, as new tires offer a clear speed advantage. Additionally, factors like tire warm-up (or lack thereof) and clear air play crucial roles.
- Other variables: Unpredictable elements such as yellow flags, safety cars, or virtual safety cars can affect the success of an undercut. The strategy is most effective when no such interruptions occur.
What is an overcut?
F1 Overcut Explained
The overcut is a race strategy where a driver stays out on track longer than their competitor, who pits earlier. The goal is to use the cleaner air and lighter fuel load (as fuel is consumed) to post faster lap times while the competitor is in the pits, ultimately gaining track position once the overcut driver makes their stop. After the pit stop, the driver who stayed out (Driver A) can often emerge ahead of the driver who pitted earlier (Driver B), capitalizing on the performance gap created during those laps.
One key factor in the overcut strategy is that Driver B, having pitted first, may struggle with tyre warm-up, particularly if they switch to a harder compound that takes longer to reach optimal temperature. In contrast, Driver A is often told to push hard on worn tyres, maximizing the car’s performance in clean air to create a time advantage. After several laps of this, when Driver A finally pits, they may rejoin the track ahead of Driver B, successfully executing the overcut.
Key Factors for a Successful Overcut:
- Tyre management: The driver staying out (Driver A) must maintain competitive lap times on worn tyres, extracting maximum performance during those crucial laps.
- Track conditions: Overcuts are common on low grip or low degradation tracks, or in wet conditions where it takes several outlaps to bring tyres up to temperature. The cleaner air and lighter car can result in faster laps.
- Competitor’s performance: If Driver B on fresh tyres encounters traffic or struggles with tire warm-up, this gives Driver A the advantage. Similarly, an overcut can be effective when there is a significant performance difference between cars, where the faster car can exploit the clean air after the rival pits.
By taking advantage of these factors, the overcut can be a powerful strategy to gain track position, especially when tyre performance or traffic conditions play a decisive role.
An undercut in action
Overtaking the opposition during a race is a real triumph, however, the full outcome of a strategic undercut or overcut does not play out until the end of the race.
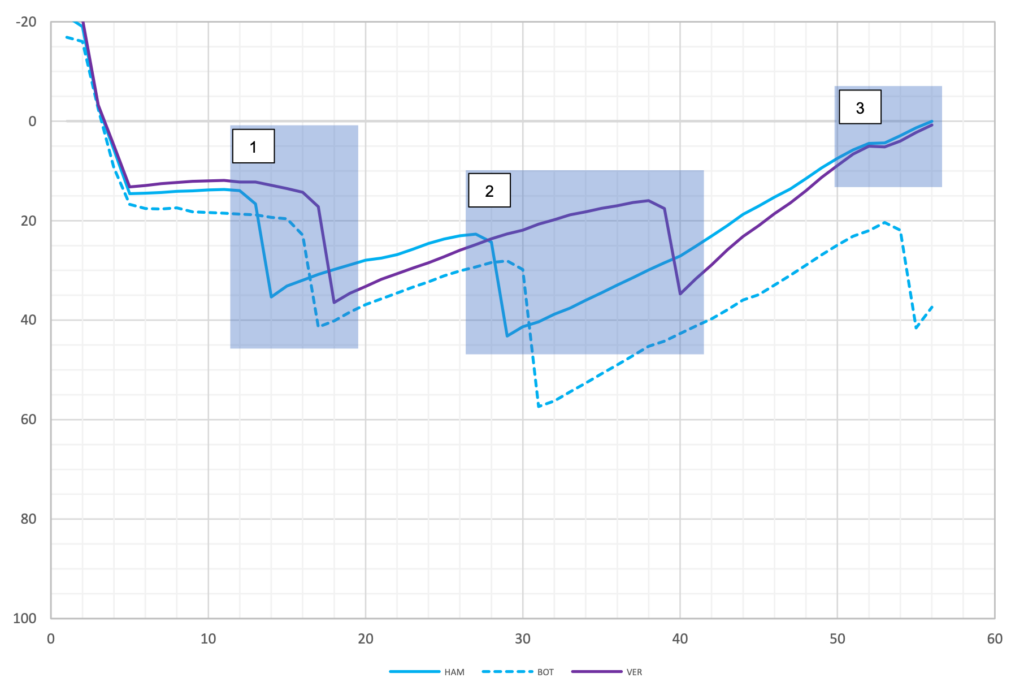
The 2021 Bahrain Grand Prix illustrates this nicely. The Sakhir layout is hard on the rear tyres and therefore presents a good opportunity for undercutting. Hamilton lost the lead to Verstappen on lap 1 and Mercedes changed their strategy immediately. At the first pitstop (1), Mercedes undercut the Red Bull by 4 laps which allowed Hamilton to overtake Verstappen on lap 18.
Hamilton was then able to build a 7s lead ahead of Verstappen and completed a second pitstop (2) on lap 28. However, to overcome the undercut, Red Bull decided to stretch Verstappen’s tyre life for another 11 laps to build a tyre age offset. Consequently, after his pitstop, Verstappen quickly catches Hamilton and battles for the lead. Although strategically Verstappen should have won, a failed pass left him in second place.
The power of an effective overcut
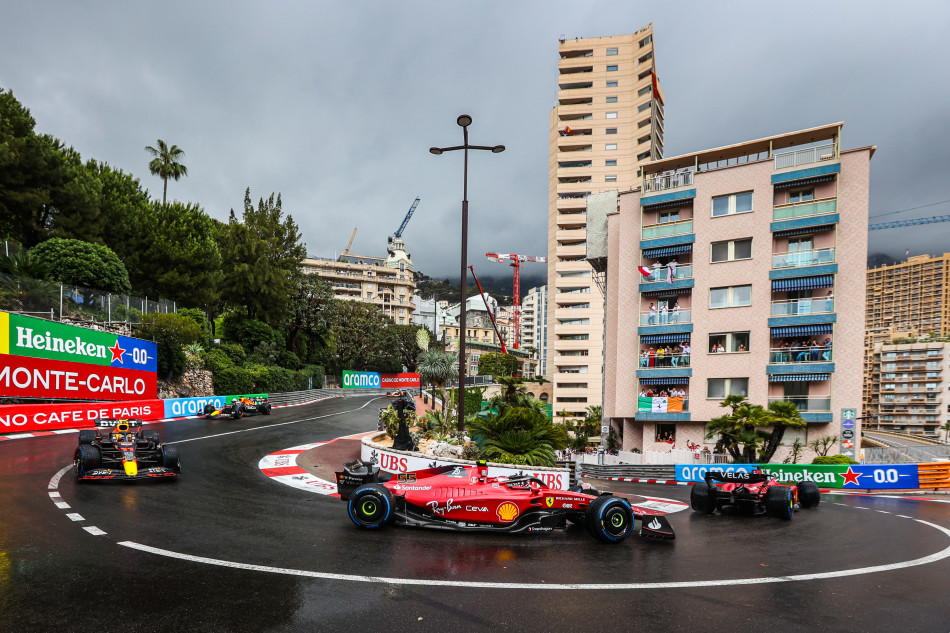
The tight streets of Monaco makes this Grand Prix dominated by traffic and tyre saving. Pitstops are undesirable as it is hard even for a fast car with a tyre advantage to make its way through the pack.
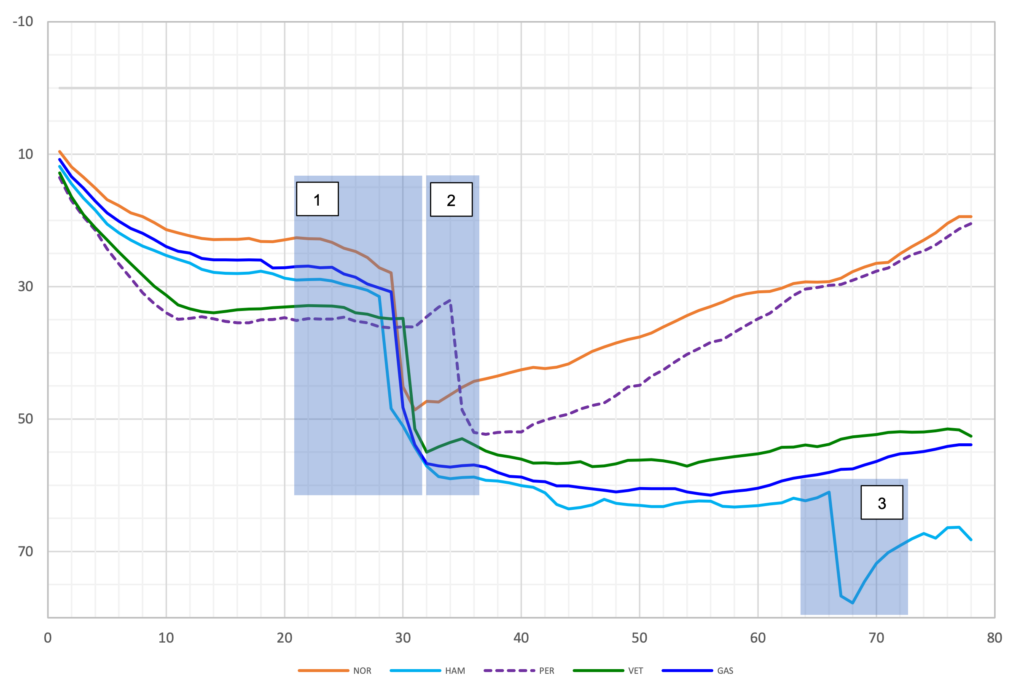
In 2021, a poor grid position left Hamilton following Gasly during the first stint. Running out of tyre life, Hamilton triggers the first pitstop phase (1), but Gasly stays out for one more lap, effectively overcutting Hamilton to stay ahead in the slower Alpha Tauri.
Vettel stays out a further lap and overcuts both Hamilton and Gasly, while Perez with a large car performance advantage, stays out for two more laps (2) and overcuts all three drivers. This manoeuvre jumps Perez from 5s behind Hamilton to over 5s ahead. In the end, Hamilton never passes Gasly, eventually stopping for a fastest lap attempt (3) on lap 66.
When to Use the Undercut vs. Overcut in Motorsports
Choosing between an undercut or overcut depends on several variables, including track characteristics, tyre degradation rates, and race conditions. For example, on tracks with high tyre wear, the undercut is often more effective, as the performance drop on old tyres is significant. However, on tracks where tyre wear is less severe, the overcut can pay off, especially if a driver can maximize lap times with a lighter fuel load.
Weather conditions also play a significant role. In cooler conditions, where tyres take longer to warm up, the overcut may be more favourable as new tyres may not deliver optimal performance right away. On the other hand, in hot conditions, where tyres degrade faster, the undercut could give a quicker pace advantage.
Moreover, strategic decisions around traffic management and pit stop timing are crucial. An undercut requires a clear track ahead post-pit stop, while an overcut can be advantageous if the driver can benefit from running in clear air before making their stop.
Webinar: How to Optimize Race Strategy and Analysis
Former Head of Race Strategy for Aston Martin’s F1 Team, Bernadette Collins, uses real examples from F1 races to help us break down the nuances of RaceWatch technology and how their usage can be applied to other sports including football, rugby, and more.
Collins discusses how teams capture more than 1,000 data points per second to power over 2 million predictive simulations. This is done through every stage from practice sessions, through qualifying, and executing on race day. Every turn, spec, and predictive simulation is met with analytical precision.
In this Race Strategy and Analysis webinar, you will learn:
- The technology powering F1 team’s analysis
- Use of Predictive simulations to Impact Performance Outcomes
- How, in the future, sports like football and rugby can harness this tech
- And more
How race strategy tools can help
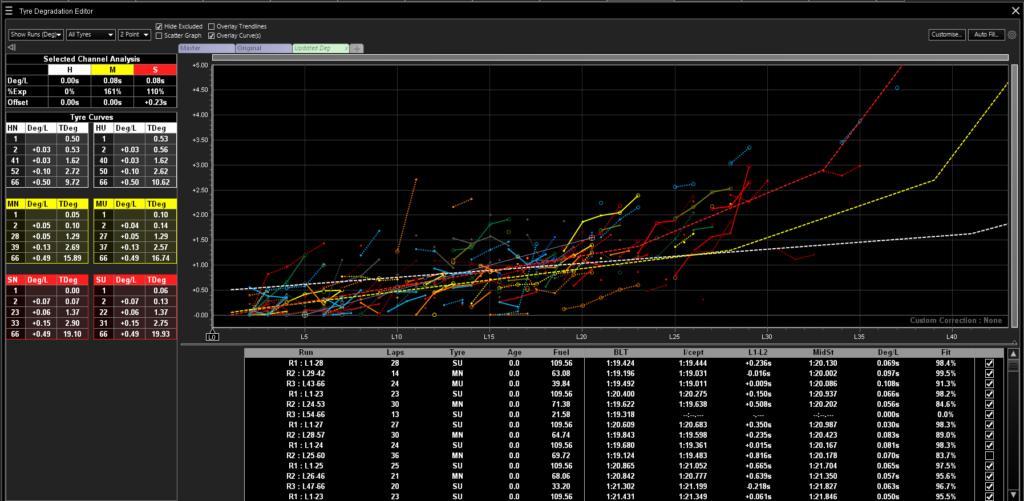
In the high-pressure environment of a race, making accurate decisions quickly is critical to outperforming competitors. That’s why strategists rely on race strategy software tools such as RaceWatch to predict the tyre degradation, pace and pitstops of other teams, to give them confidence in their decisions.
Ready to revolutionize your race strategy?
Harness the power of RaceWatch by Catapult to gain the strategic edge that could lead your team to victory. Discover the technology that empowers motorsports teams to master the art of the undercut and overcut. Explore RaceWatch now.
Article written by: Gemma Hatton