Multidirectional Load And Mechanical Power: Measuring The Cost Of Changing Direction
Hannah Knowles & Codey Moran, Catapult Sports
Key Takeaways:
- Capturing the missing half of demand: Changing direction accounts for roughly half of all accelerative demand in team sports, yet traditional speed-based metrics miss it entirely. Multidirectional Load isolates linear acceleration, linear deceleration, and lateral acceleration to provide a complete view of mechanical stress.
- A validated biomechanical model: Mechanical Work (kJ/kg) and Mechanical Power (W/kg) quantify the physical cost of movement using a four-component model that accounts for horizontal, vertical, lateral, and limb-swing mechanics. This ensures fast straight-line running and tight, small-sided drills are compared on an accurate scale.
- Real-time adjustments and objective return to play: Available live on Vector S8 and post-session on Vector S7 without new hardware, these metrics allow practitioners to modify drill intensity during a session and progress injured athletes against their own objective pre-injury profiles.
Athlete monitoring has been built on position, speed and linear acceleration. These measures describe how fast an athlete is moving in the direction they’re travelling,and they do it well. What they don’t capture is changing direction, which in team sport accounts for roughly half of all accelerative demand.
That gap has consequences a practitioner meets every week. Two drills come back identical on distance and high-speed running, but clearly were not the same session. A training block looks well-dosed on volume and does not resemble competition. An athlete passes every running-based return-to-play criteria and still does not look right turning. In each case the information that mattered was never measured, so the question could only be settled by eye.
Catapult is releasing more than 30 new parameters to close the gap. Multidirectional Load separates the two things a body does with acceleration, changing speed and changing direction. Mechanical Work and Mechanical Power describe the physical cost of both. Together they show where the demand came from, how much there was, and how hard the athlete was working. They are available live in-session on Vector S8 and post-session on Vector S7, computed from the positional data your devices already collect.
What follows is how they are derived, how they were validated, what they show and how to set them up.
Why speed-based metrics cannot see a turn
Acceleration, as it’s typically measured, is how quickly an athlete’s speed changes. Speed is a single number with no direction attached, so any acceleration built from it can only tell you when an athlete speeds up or slows down.
But in physics, acceleration is any change in motion and that includes a change of direction. Think of a car taking a roundabout at a steady 40km/h. The speedometer doesn’t move, yet everyone inside feels pushed sideways. That sideways push is acceleration, and it’s exactly what a speed-based number can’t see
The same applies to athletes. One who turns at a constant speed reads zero. One who brakes into a cut registers the braking, but none of the turn.
Take an athlete running a 10m circle at a steady 5m/s. A speed-based metric reads zero the whole way round. In reality, the athlete is pushing into the ground to hold that curve at 2.5m/s2 for the entire effort, and none of it is recorded.Combine the turning with any speeding up or slowing down and you get the total or resultant acceleration.
Splitting acceleration into two channels: linear and lateral
Add the direction of travel to speed, and acceleration splits naturally into two parts.
Linear (tangential) acceleration is speeding up or slowing down along the direction the athlete is travelling. It’s positive when accelerating and negative when braking, and it’s the part speed-based metrics already capture.
Lateral (centripetal) acceleration is changing direction, the sideways push across the line of travel. It’s zero on a straight run, and it’s the part speed-based metrics miss.
Together they give total (resultant) acceleration, how hard the athlete is accelerating at any moment, whichever way they are moving.
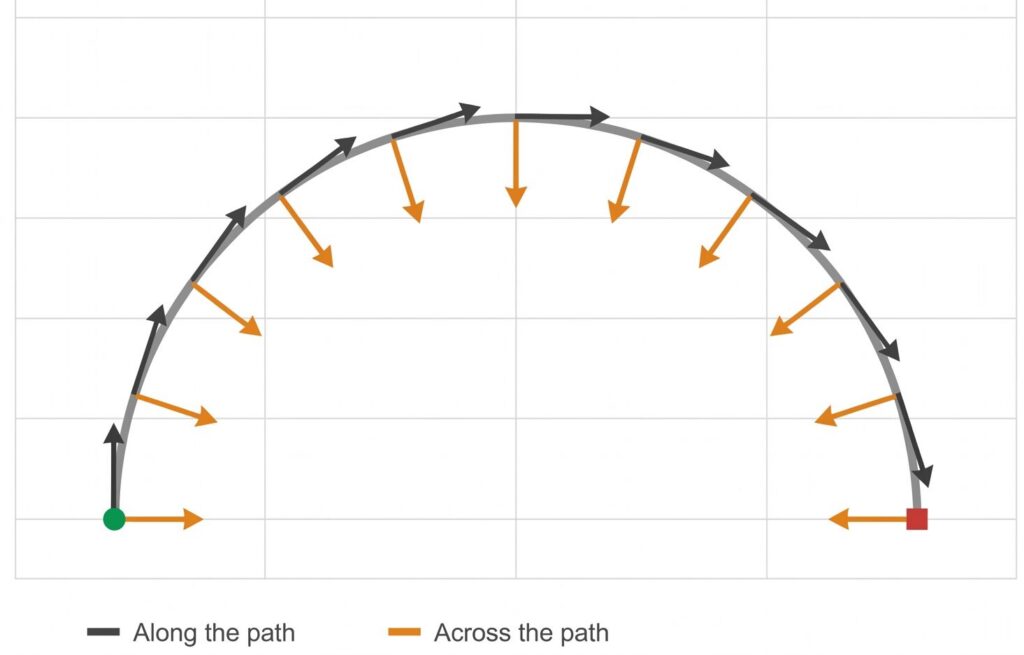
On a curve run at steady speed there is no linear acceleration. The orange arrows are lateral acceleration: the force of changing direction, which speed-based metrics miss.
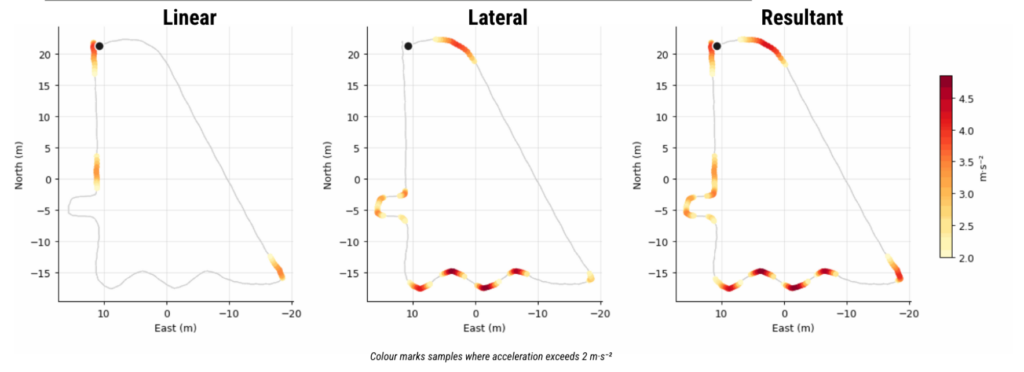
The same 45-second multidirectional circuit shown three ways. Linear acceleration (left) lights up where the athlete speeds up and slows down, lateral acceleration (middle) where they change direction, and resultant (right) combines the two. Colour marks samples above 2 m·s⁻².
Read the left and middle panels against each other and the point makes itself. The two channels illuminate almost entirely different parts of the same circuit and everything the middle panel shows is demand the athlete produced that no existing metric recorded.
Two things set how much lateral acceleration a turn produces: how fast the athlete is going and how tight the turn is. Speed has the bigger effect, double it and the lateral demand goes up four times, while halving the size of the turn only doubles it.
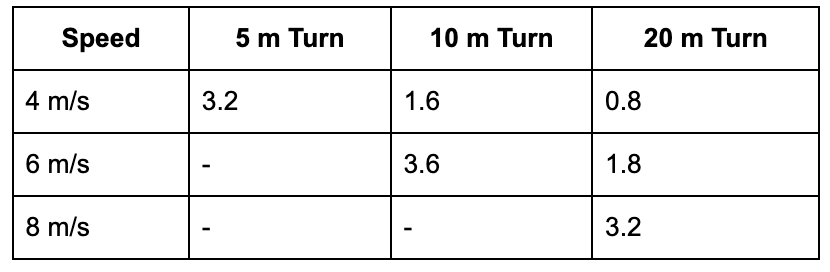
Lateral acceleration, m/s². A dash marks a turn too tight to hold at that speed.
This is a prescription tool. Because lateral acceleration rises with the square of speed and falls as the turn widens, a practitioner wanting more change-of-direction demand has two levers with quite different consequences.Tightening the grid raises the demand of each turn but keeps running speeds down. Widening it and raising entry speed drives lateral demand up while preserving high-speed exposure. Those are different sessions with different costs and until now there was no metric that could tell you which one you had actually delivered.
What Multidirectional Load reports, and how it relates to Acceleration Load
Integrating acceleration over time gives load in arbitrary units, on the same scale as the Acceleration Load metric already in use. Acceleration Load today is one absolute value for speeding up and braking combined. Multidirectional Load goes further, a single number that captures speeding up, slowing down and changing direction, which can then be separated into each of those components.
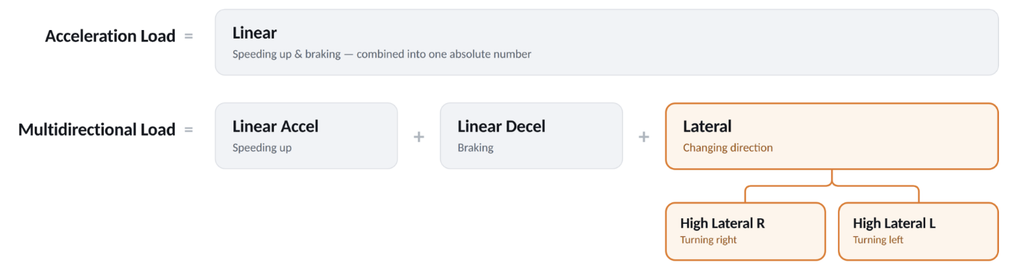
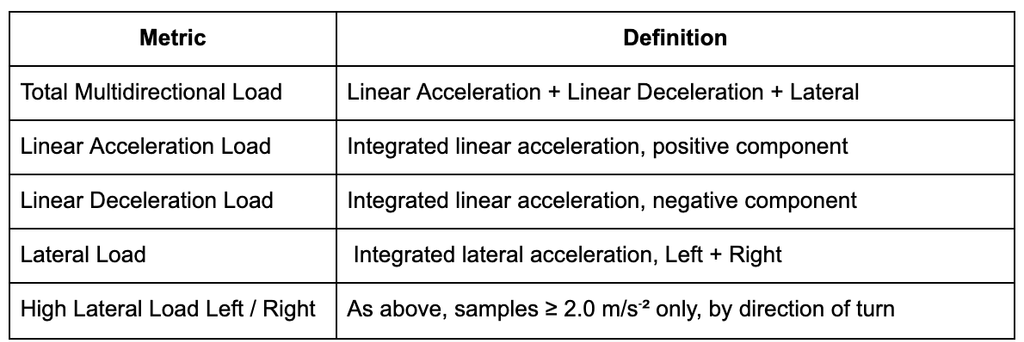
It is worth being clear about what this does to a number you already use. The linear components together reconcile with your existing Acceleration Load. Nothing has changed in how accelerating and braking are measured. They have been separated into distinct costs and a third component has been placed alongside them.
How the channels divide depends almost entirely on what the athlete is doing:
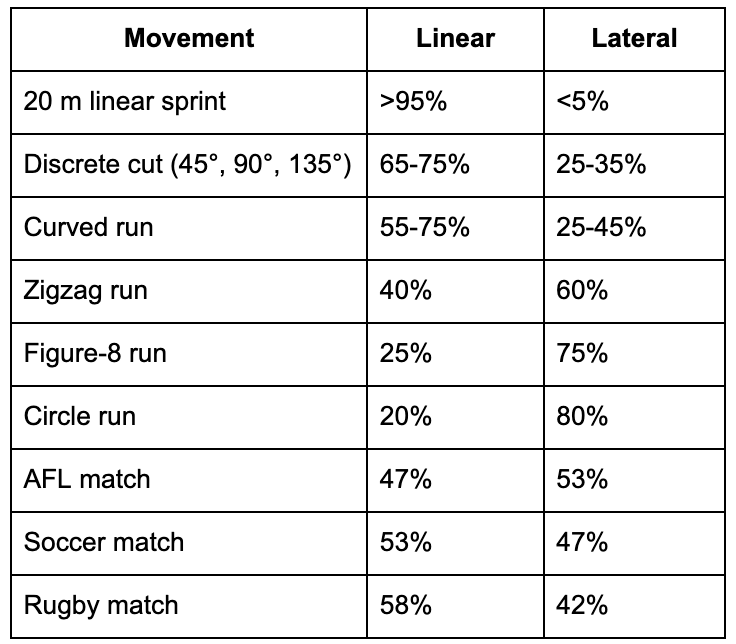
The extremes are intuitive. A 20 m sprint is almost all linear, a circle run is almost all lateral. The useful part is everything in between, because that is what sessions are actually built from and the mixture in a curved run or a zigzag is not something anyone can estimate reliably by eye. Across four team sports, lateral load lands between 42 and 53 percent of Total Multidirectional Load in match play.
From load to work: the physical cost, and the biomechanical model behind it
Multidirectional Load in arbitrary units describes the direction and distribution of accelerative demand. Mechanical Work describes its physical magnitude, in kilojoules per kilogram of body mass (kJ/kg).
Catapult’s Mechanical Work is derived from a four-component biomechanical model extended from peer-reviewed research (Gray et al., 2018, 2023).The model accounts for four distinct mechanical demands and combines them into a single Mechanical Work value:
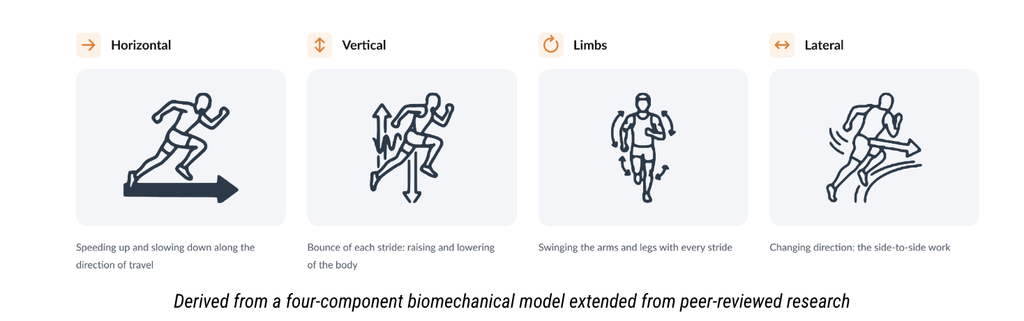
- Horizontal: speeding up and slowing down along the direction of travel
- Vertical: the bounce of each stride, raising and lowering the body
- Limbs: swinging the arms and legs with every stride
- Lateral: changing direction: the side-to-side work
Because the model accounts fo rbraking and turning separately, it captures two demands that single-figure approaches combine. The device’s speed and acceleration have been validated against Vicon motion capture in a published study (Ellens et al., 2025). The linear and lateral acceleration channels have since been checked against the same criterion, with full results to be published in a forthcoming white paper.
Including the limbs is what sets a biomechanical model apart from a single product of acceleration and speed. Swinging the arms and legs is work that does not show up in whole-body acceleration, yet it makes up a substantial share of the total at running speeds (Minetti, 1998). A model without a limb term has no way to account for it. This matters for interpretation and not only for accuracy. Without a limb term, fast straight-line running is under-read, so a high-speed running session can look lighter next to a small-sided game than it really is. That’s precisely the comparison these numbers get used to make.
Expressed as a rate, the same calculation gives Mechanical Power in Watts per kilogram (W/kg). The reported set runs from Total Mechanical Work (kJ/kg) and Mechanical Work per minute (kJ/kg/min) through Average and Max Mechanical Power (W/kg), with instantaneous per-sample power available post-session.
Multidirectional Load across a full match
The new Multidirectional Load and Mechanical Power metrics sit alongside existing metrics such as distance and high-speed running, so they can be added to current match and training reports rather than replacing them.
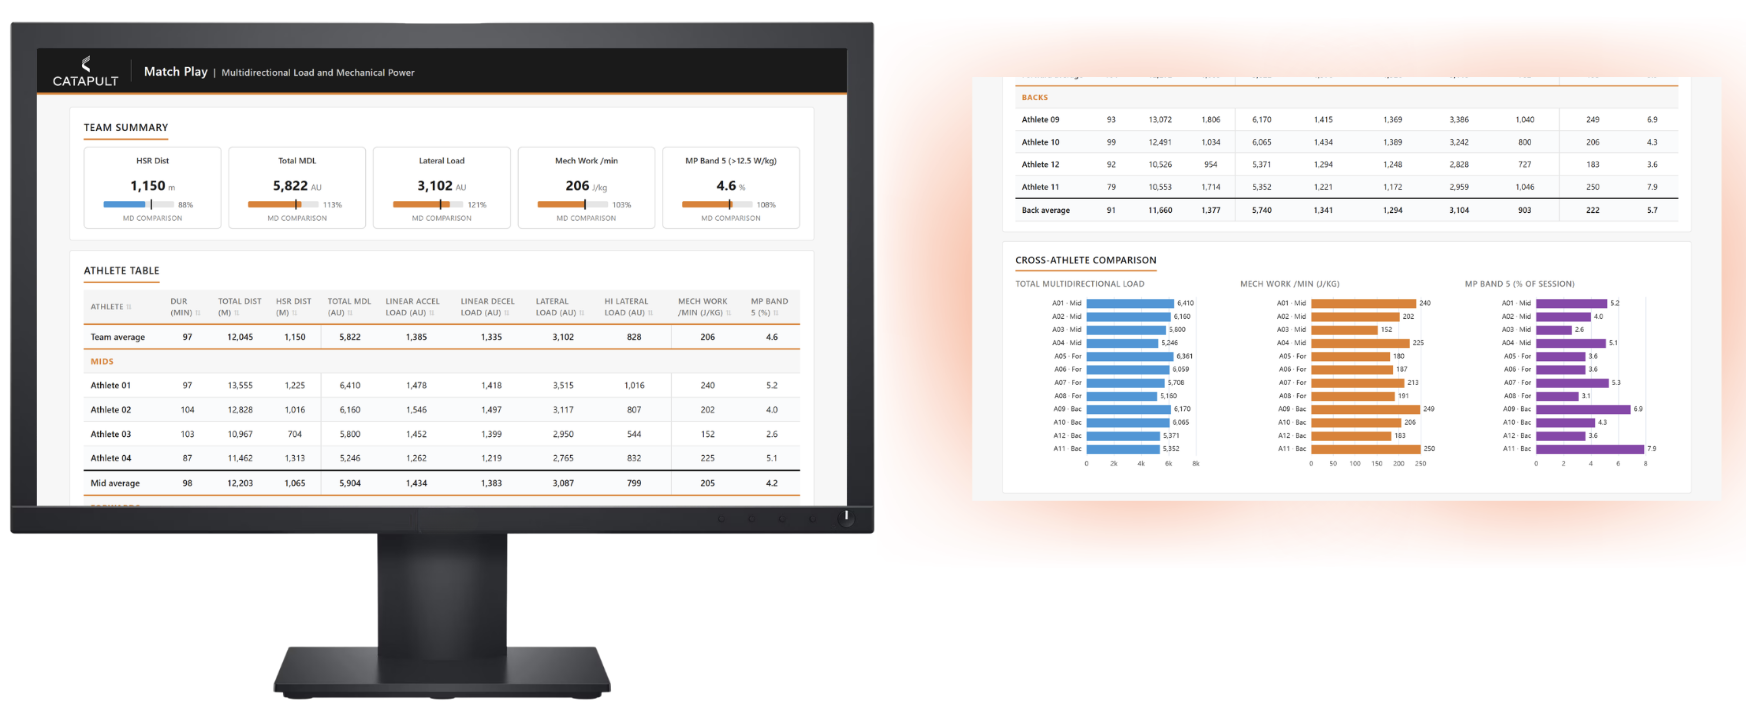
In a full match the same decomposition gives a directional profile by athlete. For the forward shown, Total Multidirectional Loadof 5,708 AU breaks into 1,312 AU of linear acceleration, 1,254 AU of linear deceleration and 3,142 AU of lateral load, split 1,507 left and 1,635 right. More than half this athlete’s acceleratory demand sat in a channel that no distance or speed metric reports.
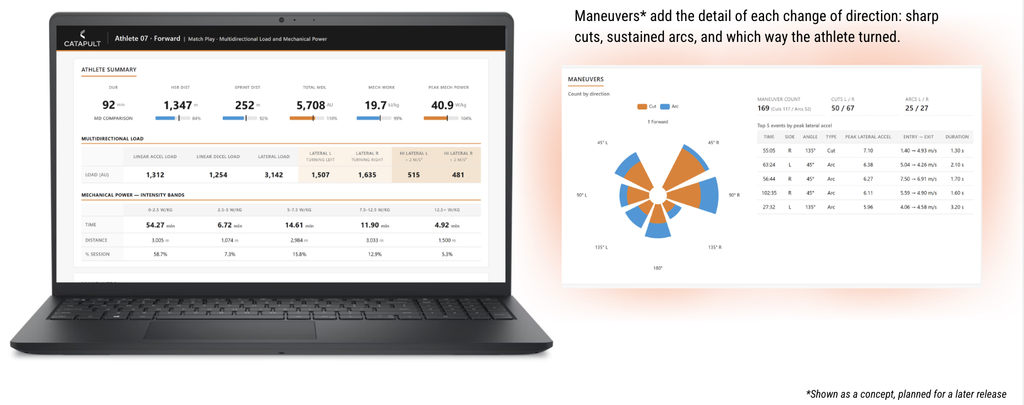
Mechanical Power is reported in configurable intensity bands, so practitioners can set thresholds to suit their sport and athlete population, then track distance and time accumulated in each. In the session shown, 59 percent of the time sits below 2.5 W/kg and 5 percent above 12.5 W/kg. That distribution is what makes it possible to confirm a drill reaches its intended intensity and distinguish a reduction in intensity from a reduction in volume.
Live on Vector S8: changing the drill rather than reviewing it
On every other system these are numbers a practitioner reads once the session has finished, which is too late to change the drill that produced them. With Vector S8 they are on the screen while the drill runs. The practitioner can see the peak within the minute and the load components accumulating in real time.
The practical use is a check on intensity with time left to act. If mechanical power has not reached the intended range by the third repetition, the drill is not going to deliver what it was prescribed for and it can be extended or cut before the rest of the session is spent on it. The same holds for a return-to-play step, where lateral load accumulating by side shows whether an athlete is meeting the prescribed exposure, while the step can still be confirmed or held.
What changes is timing rather than content. A post-session number informs the next session. A live number changes the next repetition.
Four ways practitioners will use it
Designing drills around the movement demands of competition. A match has a load signature, how multidirectional load splits between accelerating, braking and changing direction. The training week has one too. Put the two next to each other, by squad, position or athlete and the question of specificity becomes a comparison rather than an opinion.
Quantifying change-of-direction exposure. The same comparison works at drill level. Take two drills with the same duration and distance, one in open space and one in a tight grid. On distance and speed they can look identical. Lateral Load, High Lateral Load and Mechanical Work tell them apart, and drill splits show where in the session the demand sits.
Checking whether a training block is landing. Distance and high-speed running can sit flat week to week while Lateral Load and High Lateral Load climb. That is change-of-direction exposure building on a stable running base, which speed-based metrics would miss entirely. It shows whether a block is delivering the progression it was planned to.
Progressing return to play on objective numbers. Return to play typically moves from straight-line running to graded change of direction, then into game-like scenarios. Each step has usually been judged on the progression plan and the quality of the movement by eye. Lateral Load shows how much change-of-direction exposure an athlete is handling at each step, High Lateral Load how much of it is hard turning, and Mechanical Power how hard they are working while doing it. Compared against the athlete’s own pre-injury profile, the athlete progresses on the metric, not only on the calendar.
Where the metrics appear: devices, platforms and availability
All of the metrics are computed from the tracking data the devices already collect, so there is no new hardware and no change to device setup or workflow.
Vector S8 (Pro tier): live in-session, in OpenField Console and Vector Live, as well as post-session.
Vector S7 (Pro tier): post-session, in OpenField Console and Cloud.
Setting up power bands
Mechanical Power reports into up to eight configurable bands, in two sets. The absolute set uses fixed thresholds identical for every athlete, which holds the scale constant across a squad and suits drill comparison and positional profiling, alongside match-demand description. The relative set applies thresholds expressed as a proportion of each athlete’s own maximum, which suits return-to-play and individual prescription. As with maximum velocity, OpenField notifies users when an athlete records a new maximum Mechanical Power, and the profile can be updated from the notification so relative bands stay current. Each band reports duration and distance, in both raw and percentage terms.
What the model assumes and what it does not capture
Mechanical Work and Mechanical Power are reported per kilogram of body mass, which makes athletes of different sizes directly comparable. Absolute values are reported alongside for questions about total output rather than demand relative to body size.
These are external measures, computed from how the athlete moves across the ground. They do not account for collisions or contact, do not distinguish between types of muscle action, and do not describe the internal physiological cost of a session.
Multidirectional Load and Mechanical Power in summary
Multidirectional Load tells you how much acceleration demand a session contained and where it came from- speeding up, braking, or changing direction. Mechanical Work tells you what that cost the athlete physically. Mechanical Power tells you how hard they were working at any moment.
Which turns the three situations at the top of this piece into questions with answers. The two drills that came back identical on distance are separated by lateral load and mechanical work, and the drill splits show where in the session the difference sat. The block that looked well-dosed on volume can be held against the match’s own load signature, position by position, rather than against an opinion. The athlete who passes every running criterion but doesn’t look right turning can now be checked on the measure that matters: Lateral Load, side by side against their pre-injury profile.
Change of direction has always been half the demand of team sport. It is now half the measurement.
References
Minetti AE. (1998). A model equation for the prediction of mechanical internal work of terrestrial locomotion. J Biomech 31(5):463-468.
Ellens S, Moran C, Varley MC. (2025). Concurrent validity and between-device reliability of the Catapult Vector S8 GNSS device. PLoS One 20(10):e0333792.
Gray AJ, Shorter K, Cummins C, Murphy A, Waldron M. (2018). Modelling movement energetics using global positioning system devices in contact team sports: limitations and solutions. Sports Med 48:1357-1368.
Gray A, Andrews M, Waldron M, Jenkins D. (2023). A model for calculating the mechanical demands of overground running. Sports Biomech 22(10):1256-1277.
Q&A
Speed is a scalar measure with no direction attached. When acceleration is calculated solely from speed, it only measures speeding up or slowing down along the line of travel. An athlete running a curve or cutting at a steady speed registers zero linear acceleration despite pushing into the ground with high lateral force. Multidirectional Load separates linear movement from lateral acceleration to capture both channels.
Multidirectional Load measures the direction and distribution of accelerative demands in arbitrary units. Mechanical Work and Mechanical Power quantify the physical magnitude and rate of that effort in kilojoules per kilogram (kJ/kg) and Watts per kilogram (W/kg). Built on a validated four-component model (horizontal, vertical, limb, and lateral movement), they express the actual physical cost of the work performed.
No. All parameters are computed from the positional tracking data that Catapult devices already collect. Vector S8 users can monitor the metrics live in-session through OpenField Console and Vector Live, while both Vector S8 and Vector S7 users have full access to the parameters post-session in OpenField Console and Cloud.