PERFORMANCE ANALYSIS GUIDE
MATCHTRACKER WORKFLOWS
AGENDA
- GETTING STARTED: SET UP & DATA INGEST
- WORKFLOW SERIES: ANALYSING ATTACKING TRENDS
- ANALYSING PHASES
- LINE BREAK PASSES
- MOVEMENT IN BEHIND
- FINAL THIRD ACTIONS
- NEXT STEPS

GETTING STARTED # 1
SET UP & DATA INGEST
Batch Data Ingest Workflow
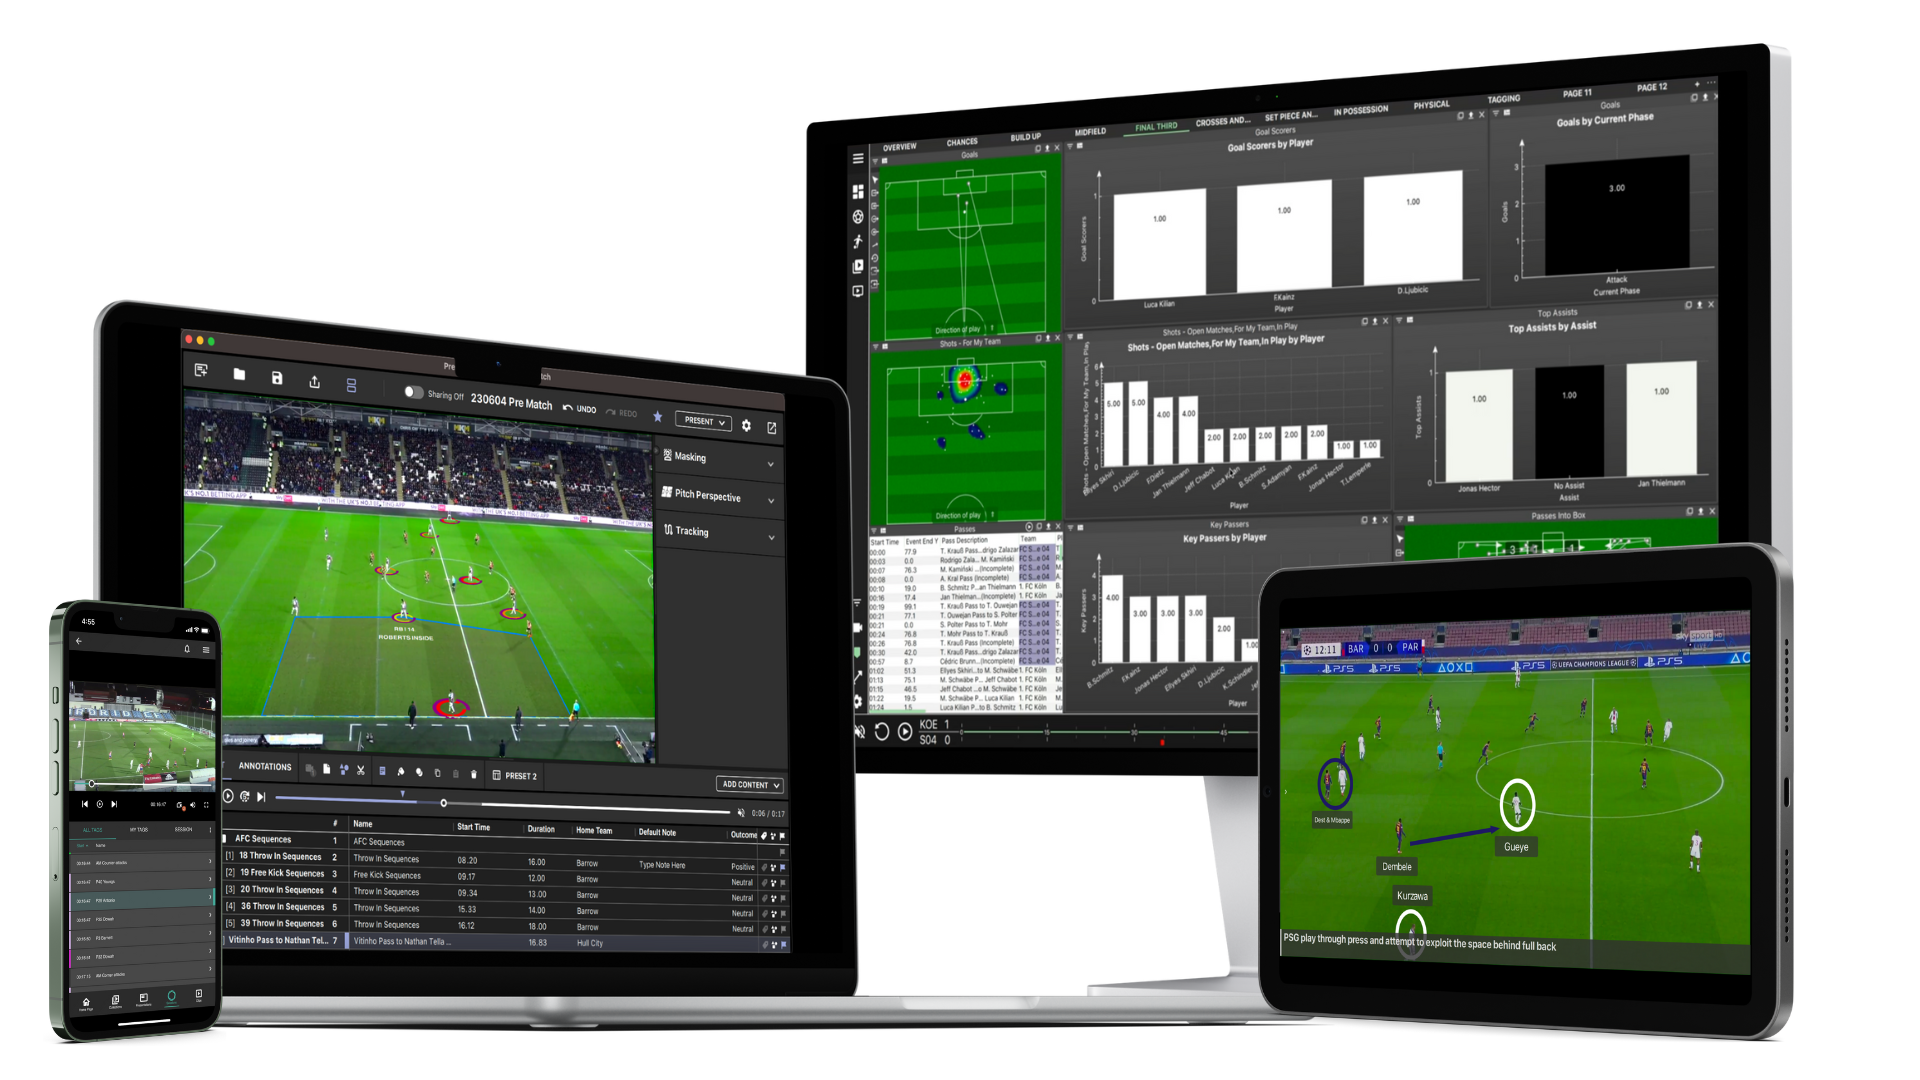
The use of MatchTracker in your workflow allows Analysts the ability to automate multiple data and video files in one place. Once uploaded, every dataset in Matchtracker can be filtered and visualised to gain tactical insights with the added context of video.
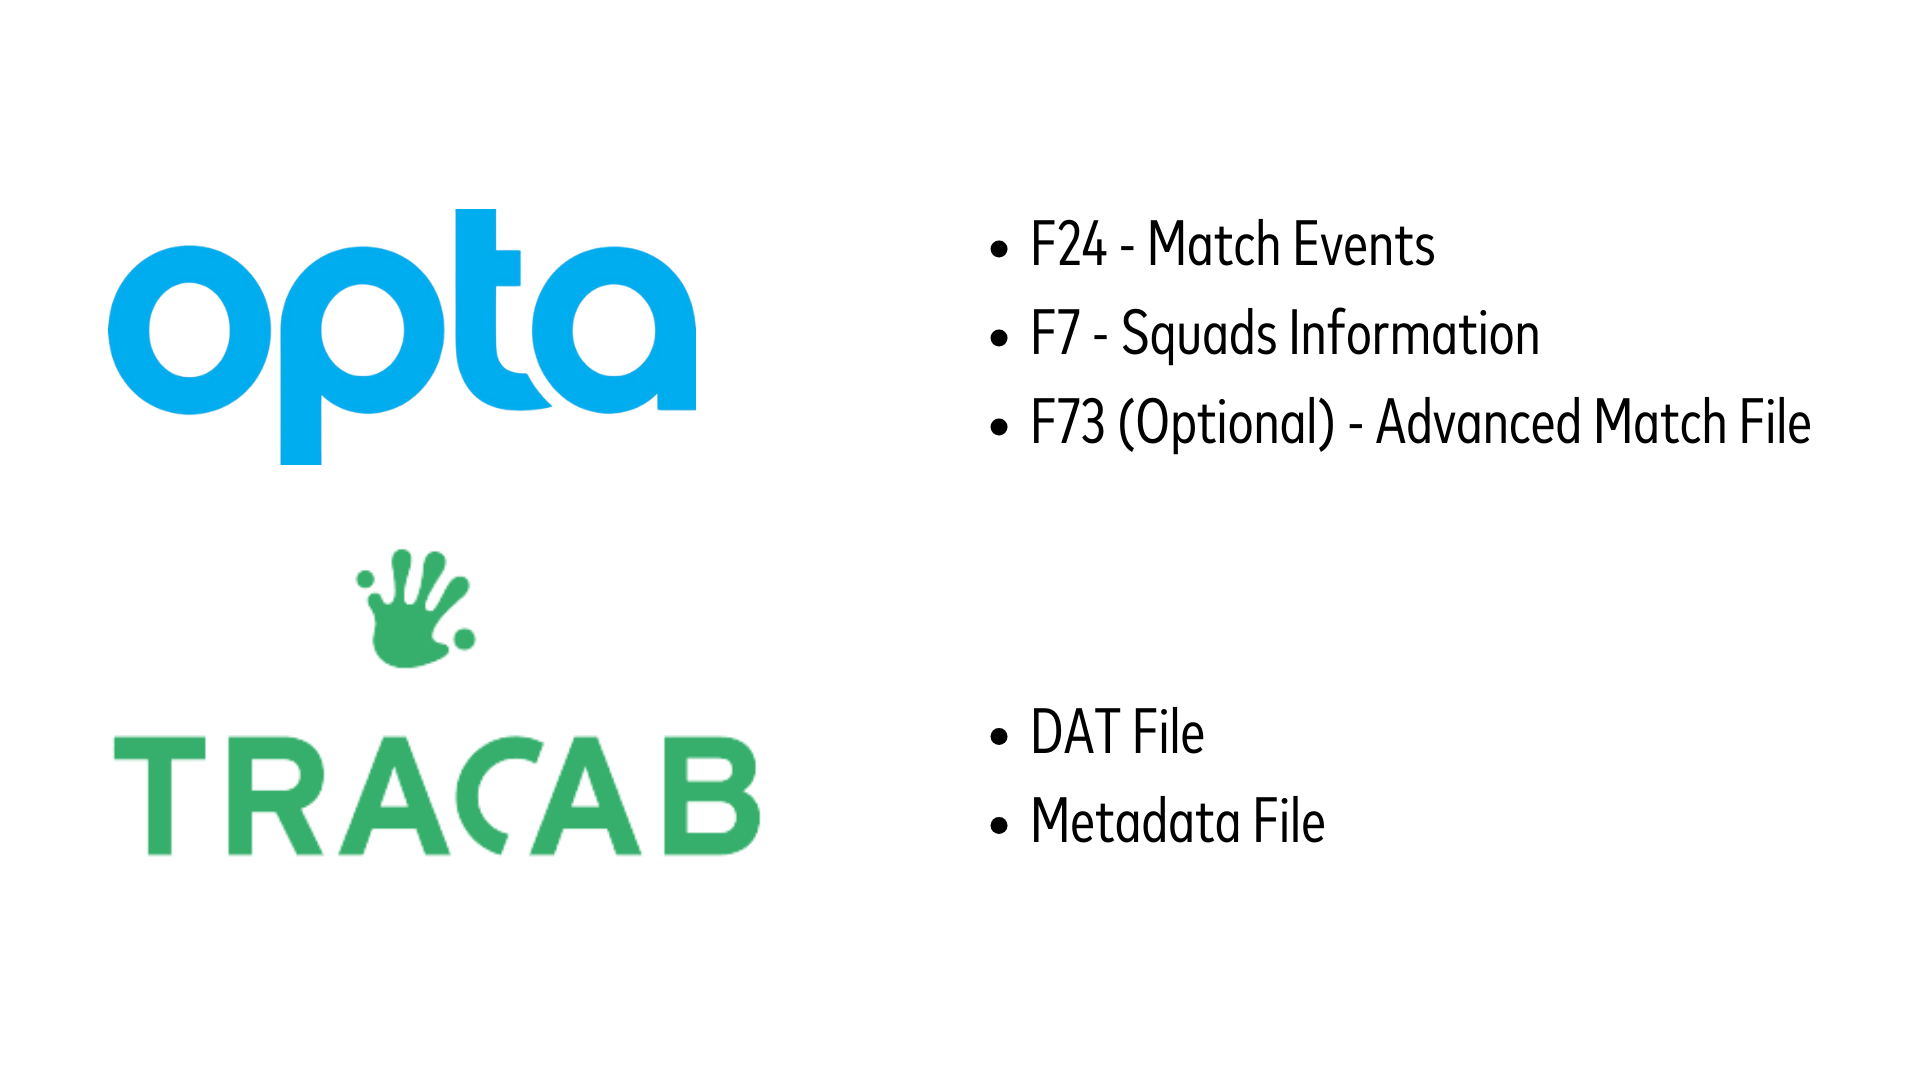
With the access to Opta eventing data and TracAb positioning data in the Dutch Eredivisie, these files can be used to create games in MatchTracker to easily power your analysis process.

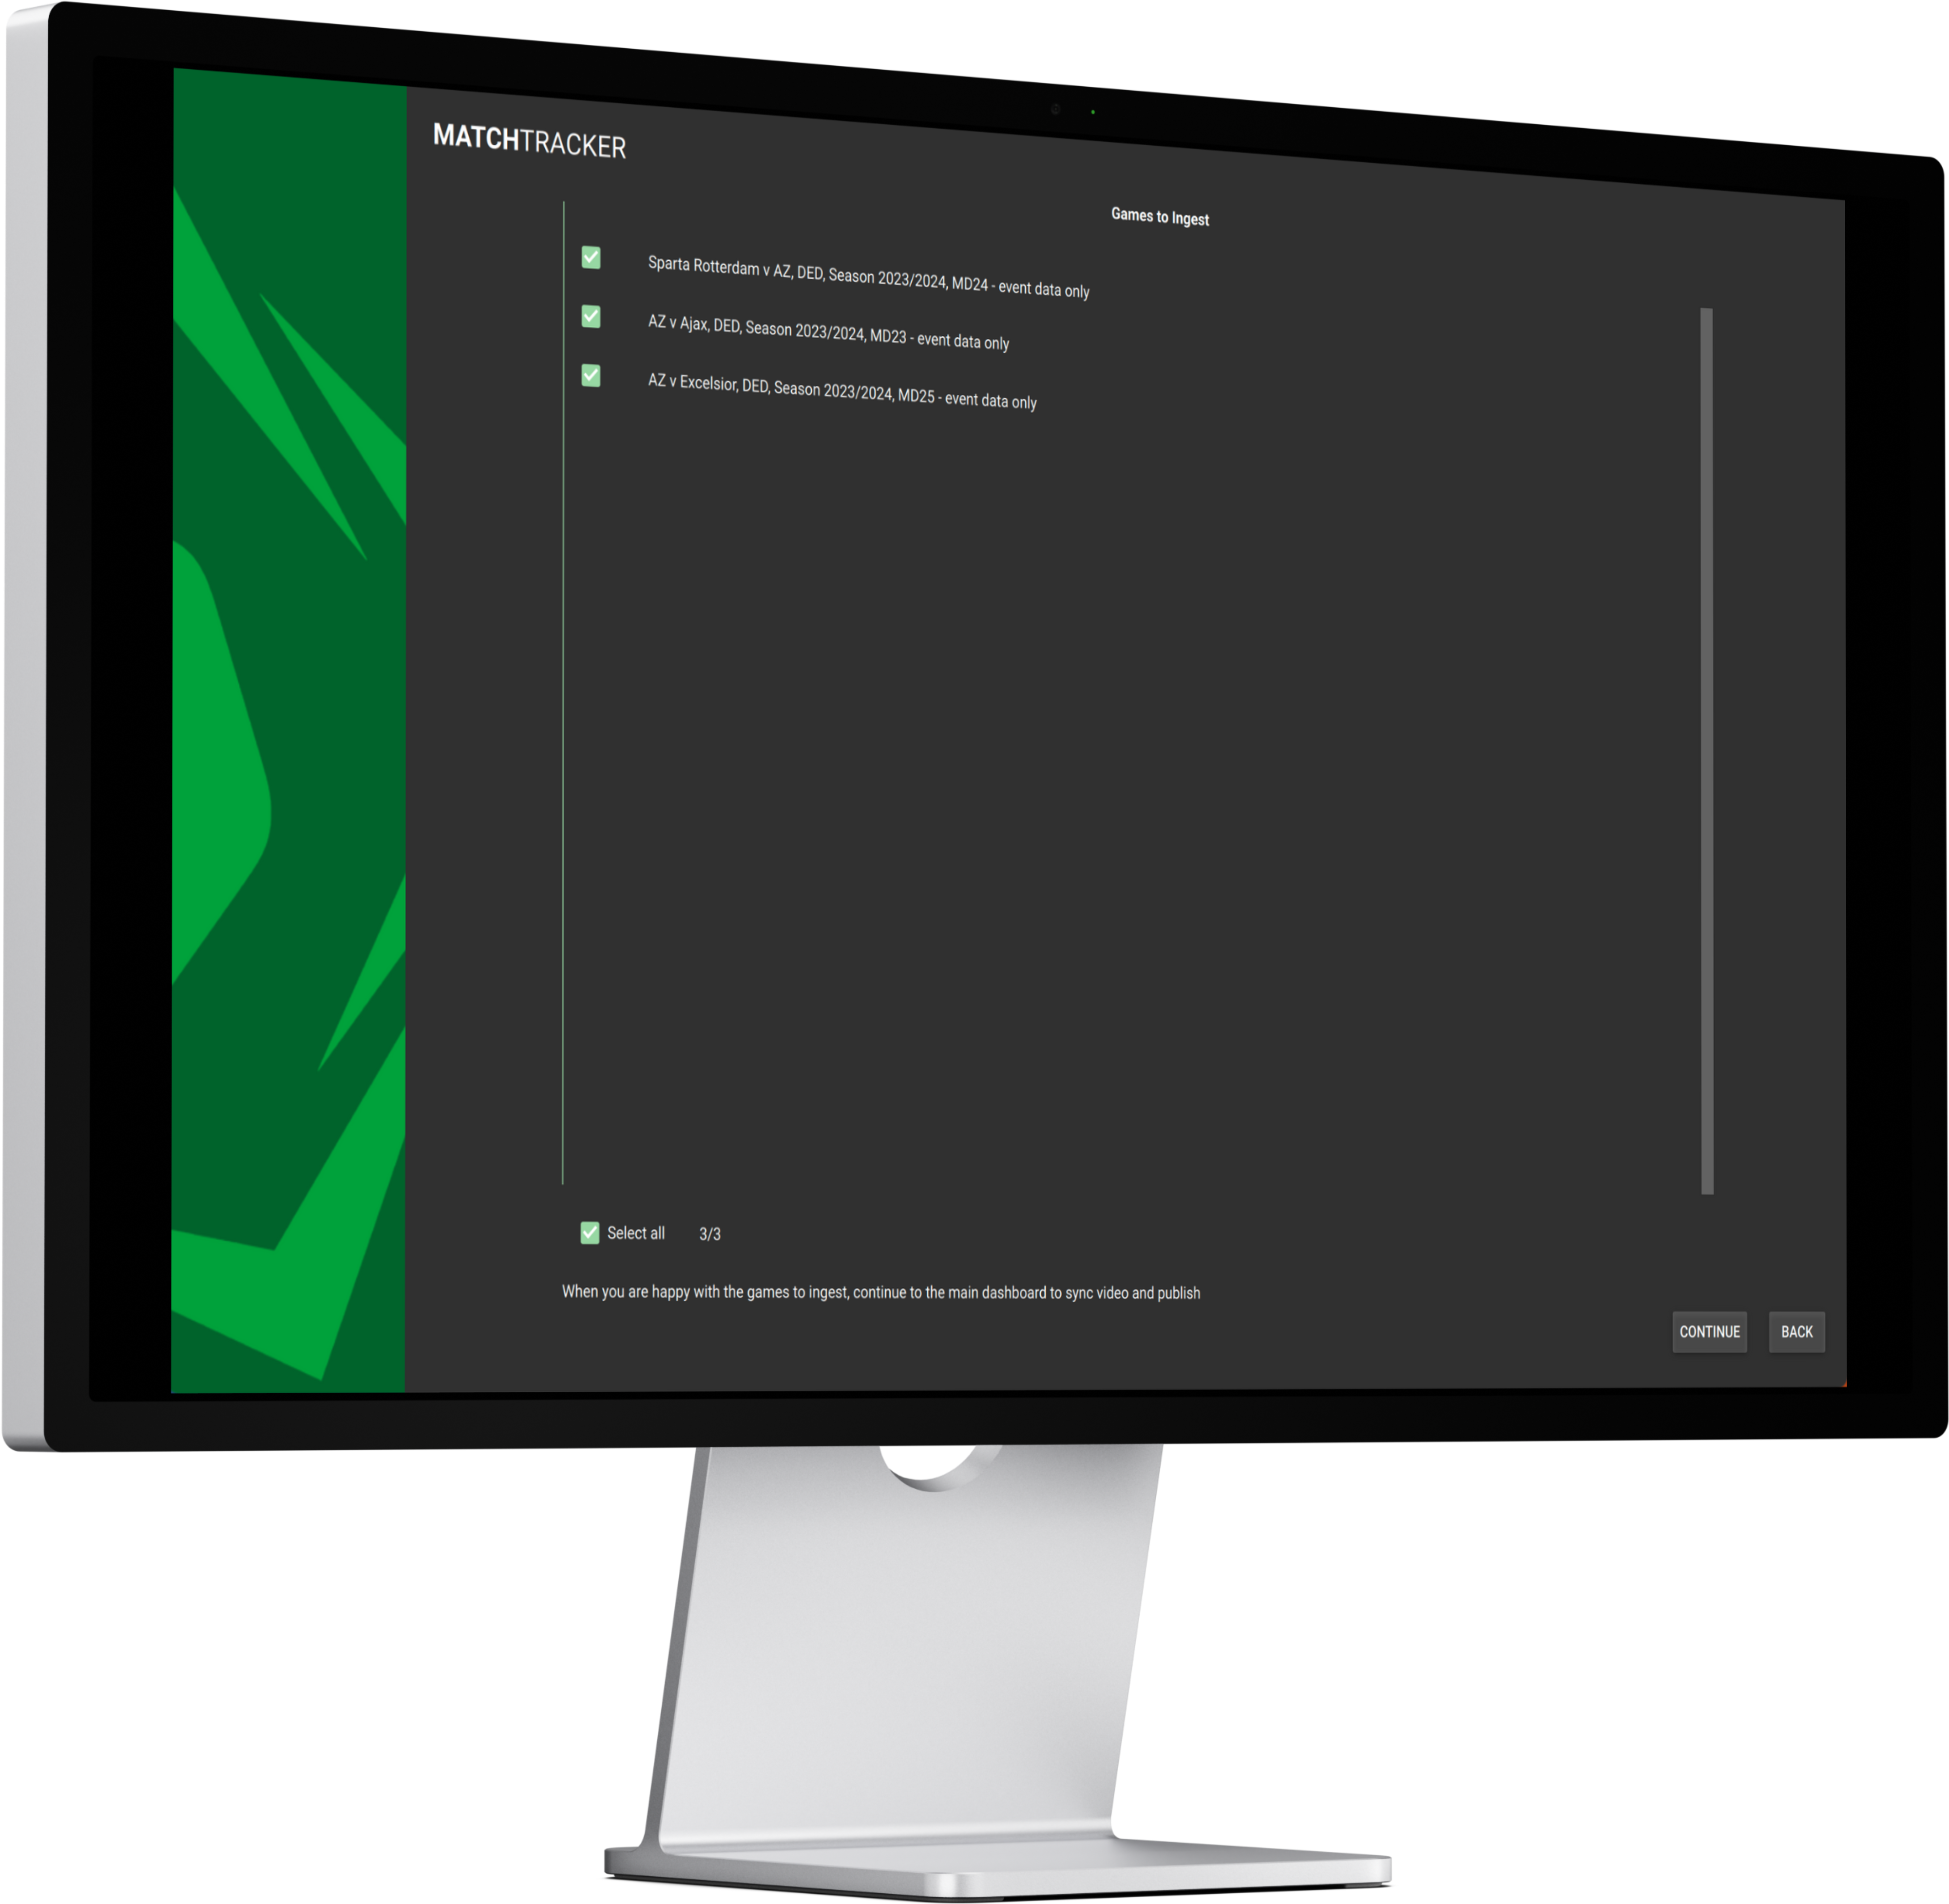
Using the match creation option, we can easily create a batch of games using these files via our Batch Ingest option.
Once games have been created we can then import the corresponding video file(s) in order to sync this to the data and for us to start our analysis.


GETTING STARTER #2
BUILDING CUSTOM WORKBOOKS
It's easy to create customised Workbooks in MatchTracker by interacting with the numerous different Display types on the left hand side panel. These Displays contain information from the event (Opta) and position (TracAb) data files and allow us to filter for specific moments of the game we want to review (e.g. Passes, Shots, Carries, Sequences, Phases etc.).
This gives us an effective way of focusing on any part of tactical or technical performance we want to analyse to answer specific performance questions. In this example we can see how easy and effective MatchTracker can be to analyse attacking trends for an upcoming opponent to uncover a specific playing style and tendencies.
ANALYSING ATTACKING TRENDS
EXAMPLE WORKFLOW #1
ANALYSING PHASES
Understanding Phase Types
The Phases display allows us to filter for all the times a team were in a specific phase type (e.g. Build Up, Possession, Attack etc.) as well as being able to filter for how long these phases occurred for and where they start/end. By changing the view of the display we can easily create a Chart to represent the total time each team spent in each phase type and normalise this data to show as a percentage of their overall in possession break down.
AVERAGE PHASE LENGTH
At the same time, it’s possible to show the average time the team spends in each phase type so we can gain a clear picture of what type of attacking team they are and how they like to use the ball. For example, we can now gain insight as to whether this opponent are a heavily counter attacking team, or do they tend to spend more sustained periods of time in build up phases.
EXAMPLE WORKFLOW #2
BALL PROGRESSION
Filter Data To Visualize Ball Progression
The Passes display allows us to filter for specific pass types in certain areas of the pitch and then show this information in different ways. We can easily filter for passes which have occurred during a specific phase type, as well as passes with certain characteristics such as line breaks.
By switching the display to the Pitch View, we can then see the start and end locations of these filtered passes on the pitch.
Adding Pitch Overlays
Adding a custom pitch overlay allows us to break the pitch down into customised areas with specific names and then view frequencies of start or end locations for our filtered events. In this example we can then easily view how many of these line breaking passes have ended in the different channels of the pitch, made even clearer by overlaying a heatmap for the end locations of these passes.
Filter Data across Linked Windows
Linking windows allows us to use the same filter set for multiple windows whilst viewing the same information in an alternative view.
For example, we can copy a display, paste in with Linked Filters and change to a Chart View, all whilst maintaining the same filter set. Here, we are reviewing the same passes as we have displayed on the pitch view, whilst charting for which players play and receive these line breaking passes most frequently.
Highlight Details by Applying Column Filters
Applying additional filters to columns then allows us to add extra details to the types of clips we are then able to see.
For example when we take all of the line breaking passes we have already filtered for, we can then apply an additional filter to the Bypassed column. This means we can then show only the “higher value” passes which eliminate a minimum number of players from the game and easily link this back to the video.
EXAMPLE WORKFLOW #3
MOVEMENT IN BEHIND
Automating Alerts
When using position (TracAb) data in your analysis users will also get access to Alerts within MatchTracker. Alerts are additional derived metrics which come from knowing the player and ball locations to allow us to see moments such as individual Player Pressures, Receptions Between the Lines or Runs In Behind the back line. Like we can with all other displays, we can start to show how frequently each player performs any of these Alerts compared to others, as well as the exact locations of these events on the pitch.
In this example we are able to see which players perform these Runs In Behind most frequently, as well as displaying these on the Pitch View and even viewing which phase types they are occurring in.
Assigning Pass Groups
The Passes display can also be used to filter for more specific pass groups. One of these groups is Ball in Behind, where any attempted pass in behind is available to view in its own pass group. Whilst in the Pitch View we can see the start and end positions of all these passes but can also show the relative outcomes (complete or incomplete) of these passes too. This allows us to clearly see these passing patterns in relation to how the team progresses the ball in certain areas of the pitch, as well as the most common player connections for these passing areas. Highlighting these player connections is again possible through the creation of charts to represent passing and receiving players.
In this example we are able to see which players perform these Runs In Behind most frequently, as well as displaying these on the Pitch View and even viewing which phase types they are occurring in.
EXAMPLE WORKFLOW #4
FINAL THIRD ACTIONS
Filter & Display Set Pieces & Crosses
The Set Pieces And Crosses display allows us to filter for any set piece types as well as crosses from open play. Custom pitch overlays allow us to then split up certain areas of the pitch into designated zones using our own naming conventions. These custom pitch zones are then easy to represent in our charts by stacking this information in each bar. This gives us a more detailed breakdown of not only who we expect to cross most frequently, but from which areas specifically.
We can then filter for all first contacts from our team of interest and see which players are gaining 1st contacts most frequently within the box. The live pitch position allows us to track the movements of these runs in relation to the opponents, whilst viewing run trajectories with layer trails to see patterns in their movement.
